CALCULATIONS AND STATISTICS FOR ACCELERATED FATIGUE TESTING OF SYSTEMS
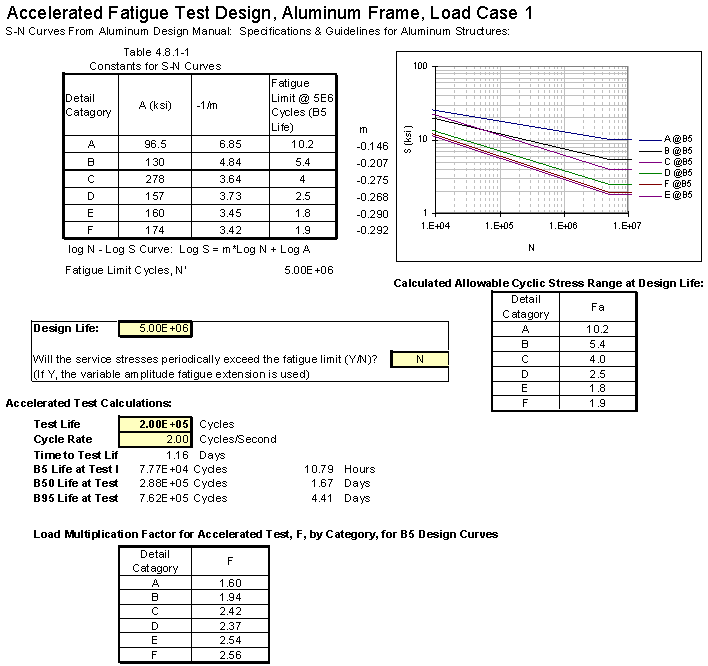
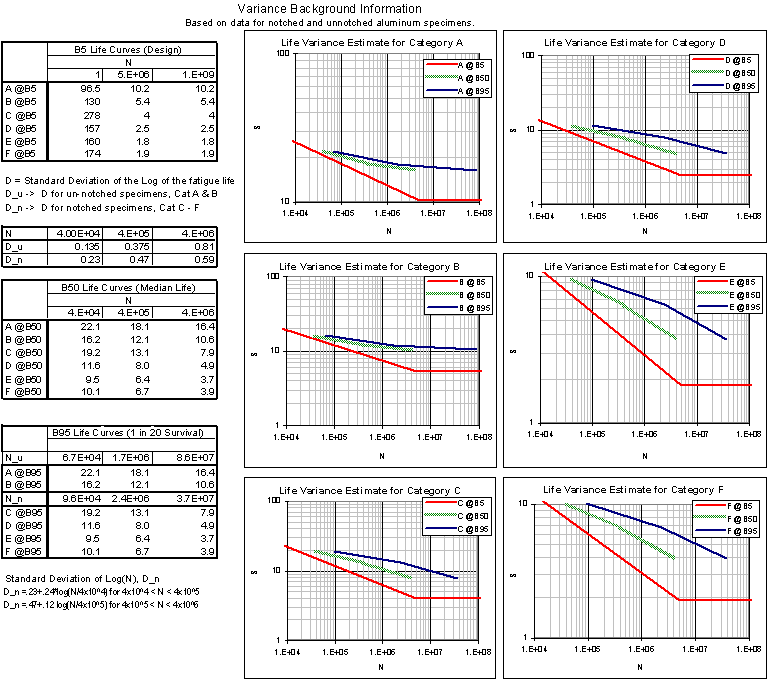
Prediction of fatigue by analytical means is always approximate, especially for weldments. However, we need a starting place from which to design and from which to base the fatigue test. It is hoped that either the design can be validated or required design changes can be identified without too large of a testing sample.Several calculations are performed in the spreadsheet below. First, the fatigue design curves from the Aluminum Association's Specifications and Guidelines for Aluminum Structures is presented. These curves are based on a 95% survival rate at a 95% confidence level from the underlying data, i.e. the B5 lives. In order to predict the behavior of the structure, more information is needed. Specifically, a model of the distribution of life to failure. We have not yet chased down the underlying data for those curves. Instead, we have used data for Logarithmic standard deviation of life for notched and unnotched aluminum specimens developed for aircraft structures (H.O. Fuchs & R.I. Stephens,"Metal Fatigue in Engineering", John Wiley & Sons, 1980) (See the third spreadsheet). This enables us to proceed with a meaningful estimate of the behavior of the system.
The design life and the test life are identified, in this case 5 million cycles for design and 200,000 cycles for developing the accelerated test load. 200,000 cycles is not likely to be the actual test life, rather this number is used to develop load multipliers for each of the fatigue categories (A-F). Also shown on the first spreadsheet is a summary of the predicted system life distribution, the B5, B50, and B95 life derived from the second spreadsheet of detailed life statistics.

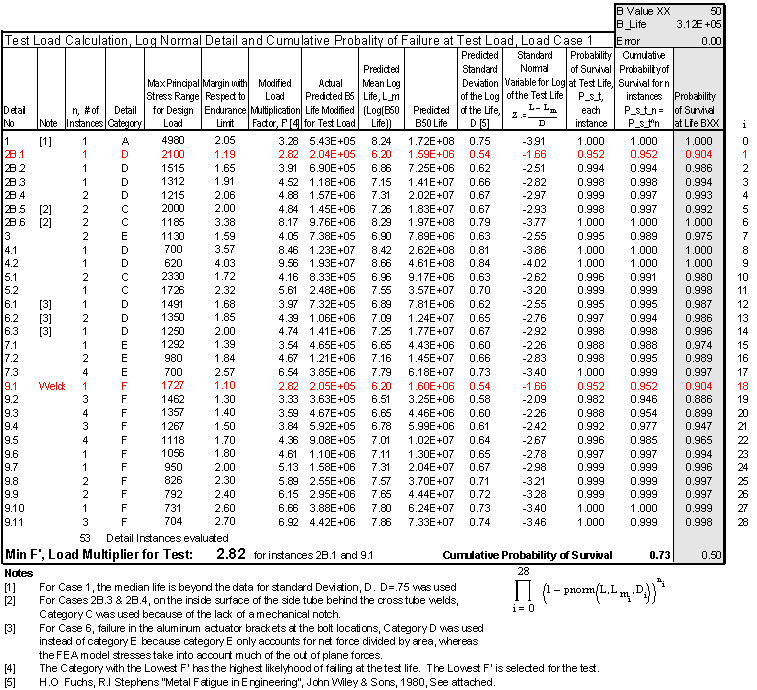
The second spreadsheet, presented below, is the meat of the analysis. The rows contain each detail of the design analyzed and are further divided by stress ranges for each detail where multiple copies of the detail exist. For each entry, two calculations are performed.First, the allowable stress range at the design load for each detail (from the B5 design curves) are divided by the structural stress range predicted by stress analysis (shell element FEA) to obtain the design margin. This margin is multiplied by the load multiplication factors for the "test life", F, in the above spreadsheet to obtain a "modified load multiplication factor", F'. The minimum calculated F' corresponds to the detail that will be most likely to fail in the accelerated test (which, because the slopes for the fatigue category s-n curves are different, may not be the most likely detail to fail in service).
No allowances were made for the size effect. All of the materials in this design are well under 1 inch (25.4 mm) in thickness, making the omission conservative. Data is less readily available for aluminum than for steel.
For this analysis, the minimum F' occurs at two locations: at detail 2B, failure in the side tube at the toe of the weld to the cross tube, at entry 2B.1, the instance of detail 2B with the highest calculated stress range and at detail 9.1, failure in the weld of a different detail, with a load multiplication factor of 2.82. These detail instances, 2B.1 and 9.1, are predicted to have a B5 life of 2x10^5 cycles (the "test life") when the system is cycled at a constant load of 2.82 times the design load. Also note that detail 2B.1 has a margin of 1.19 at the design load while detail 9.1 has a margin of 1.1. In service, detail 9.1 is more likely to fail. With the accelerated fatigue test, however, detail 2B, with a fatigue classification of D, degrades more rapidly , as the load is increased (flatter curve) than detail 9.1, with a classification of F.
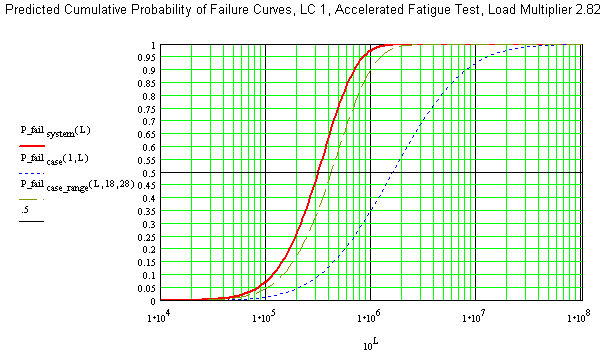
The second set of calculations of the spreadsheet are lognormal distributions for each detail entry based on a load multiplication factor of 2.82. First, the B5 life for each detail entry is calculated from the Aluminum Association design curves and the calculated stress values. From the variance predictions, the mean of the log of life and standard deviation of the log of life are estimated. From that point, standard normal statistics for mutually independent events are applied to predict the system reliability and distribution of test lives. These distributions are plotted beneath the spreadsheet.


CLICK HERE for Further Discussion of Calculations of System Life Statistics
